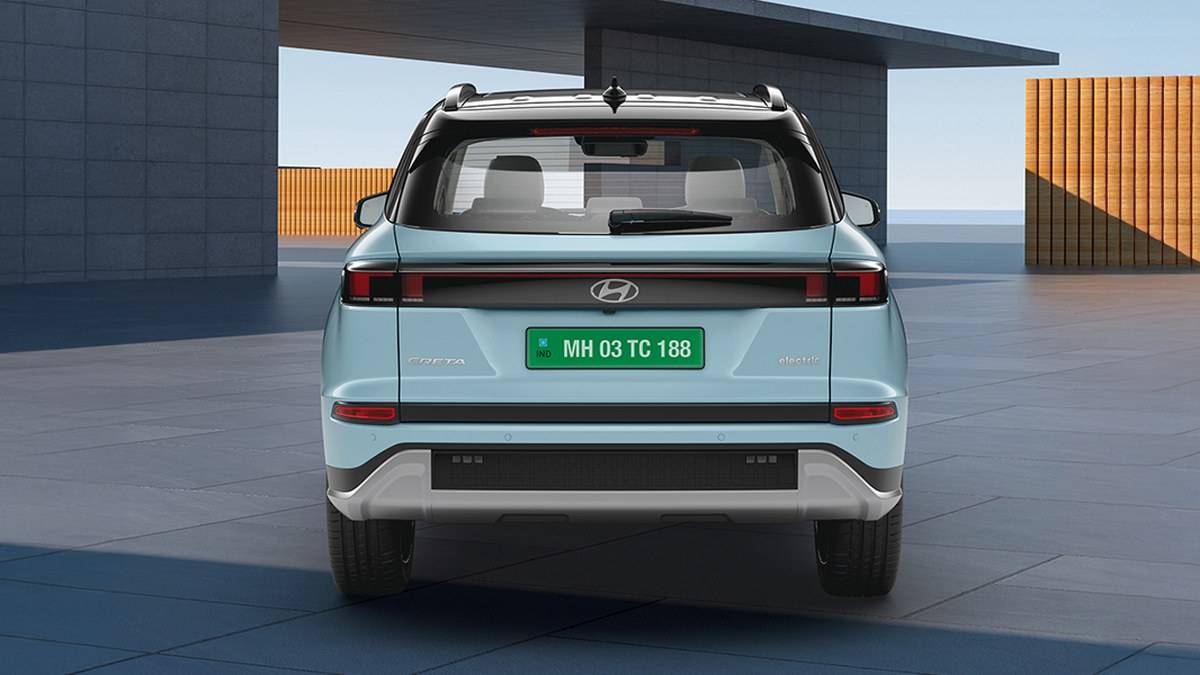
India’s October vehicle-sales releases tell two different stories that should not be confused. Manufacturers reported growth in shipments, including exports, while FADA’s registration-based retail figures fell against the previous October but rose from September. The distinction matters: a vehicle dispatched by a manufacturer is not automatically a vehicle registered by an Indian customer in the same month. Combining those measures into a single sales ranking would give readers a misleading comparison.
What the manufacturers reported
Maruti Suzuki reported total October sales of 276,120 vehicles, against 220,894 a year earlier. Its domestic passenger-vehicle tally was 212,384, compared with 176,318. The wider total also included light commercial vehicles, sales to other manufacturers and exports. Exports stood at 49,872, while sales to other manufacturers were 9,459. For readers assessing the Indian passenger-car market, the domestic passenger-vehicle line is therefore the more relevant comparison than the company’s overall headline volume.
Tata Motors Passenger Vehicles reported 75,426 vehicles across domestic and international operations, up 23% from 61,295. Domestic sales were 73,894, up 21%, while international business contributed 1,532. Electric-vehicle sales, including domestic and international business, reached 16,244, an increase of 75%. Those EV figures form part of the passenger-vehicle business; they should not be added again to its total when estimating the company’s monthly volume.
The separate Tata Motors commercial-vehicle release recorded total sales of 47,652, against 37,530, a rise of 27%. Domestic commercial-vehicle sales stood at 39,784, up 13%, and international business contributed 7,868. Keeping the passenger-vehicle and commercial-vehicle releases separately labelled is important. They cover different businesses and customer segments, and neither figure alone describes all vehicles carrying the Tata name.
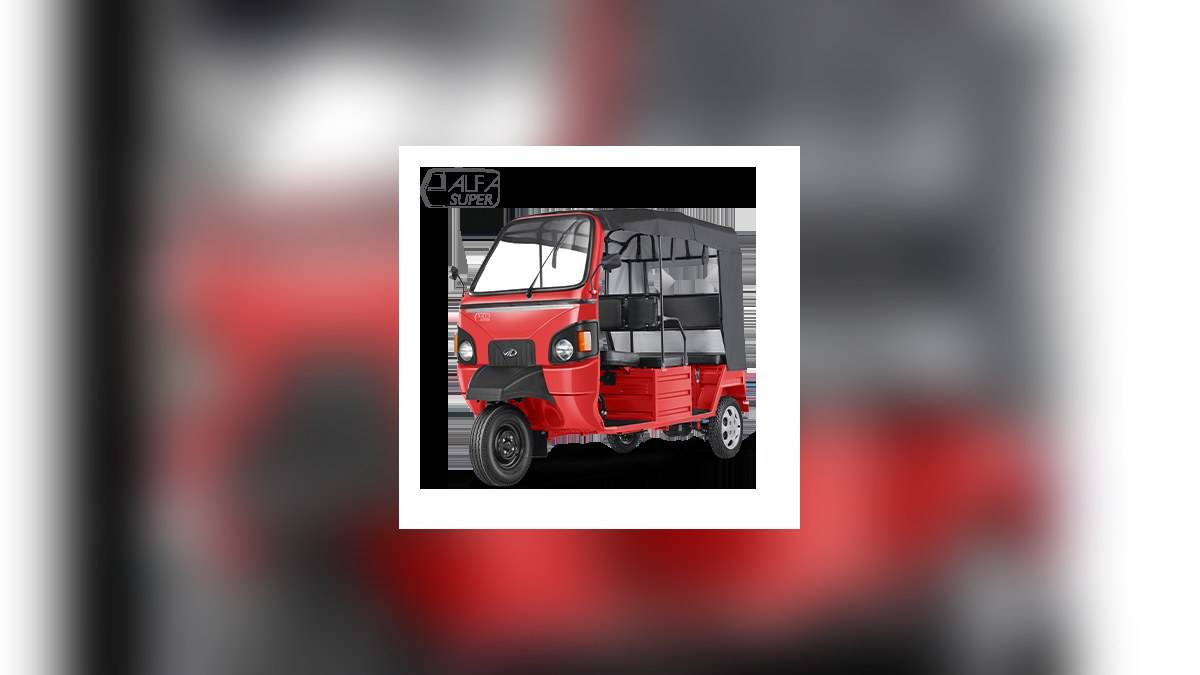
Mahindra reported overall automotive sales of 131,109 vehicles, including exports, up 9%. Domestic utility-vehicle sales were 73,338, a rise of 2%, while the utility-vehicle total including exports was 74,904. Domestic light commercial-vehicle sales below 3.5 tonnes stood at 33,037. The company’s tractor figures belong to its separate farm-equipment release and are not part of that automotive total. An SUV-only comparison should therefore use the utility-vehicle number rather than Mahindra’s broader automotive headline.
Hyundai Motor India’s exchange-addressed release put total sales at 82,299, up 17.7%, comprising 62,799 domestic vehicles and 19,500 exports. Domestic sales increased 16.7%, while exports rose 21.1%. Hyundai described both its overall and domestic monthly totals as records. The company also reported 13,017 domestic Venue sales. These figures distinguish the performance of its Indian customer-facing business from the additional contribution of vehicles manufactured for overseas markets.
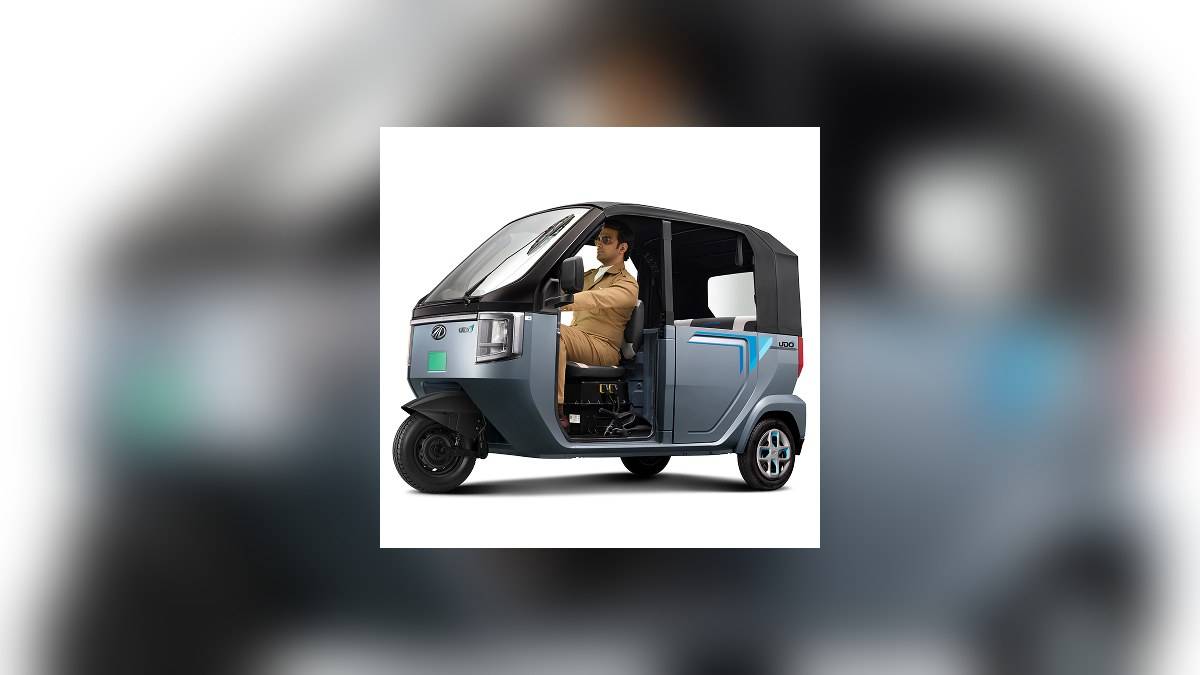
TVS Motor reported total sales of 700,134 vehicles, compared with 543,557 a year earlier, an increase of 29%. Two-wheelers accounted for 670,679 and three-wheelers for 29,455. Domestic two-wheeler sales were 514,764. Electric two-wheeler sales reached 71,382, against 32,387. The total includes more than domestic motorcycle and scooter demand, so comparisons with another company need the same vehicle category and geographical scope rather than simply matching the largest numbers.
Bajaj Auto reported 591,876 vehicles, up 14% from 518,170. That comprised 501,194 two-wheelers and 90,682 commercial vehicles. Across both categories, domestic sales were 351,148 and exports were 240,728. Its disclosure separates each category into domestic and export business, making clear why the overall total should not be treated as Indian two-wheeler retail demand. The company’s two-wheeler subtotal rose 13%, while commercial vehicles increased 20%.
Hero MotoCorp reported dispatches of 734,403 motorcycles and scooters, against 635,808, a rise of 16%. Domestic dispatches were 705,084 and exports were 29,319. The product split was 629,800 motorcycles and 104,603 scooters. Here too, dispatches are the measure being reported. They are useful for tracking the manufacturer’s supply volumes, but should not be substituted for customer registrations when comparing the performance of brands in FADA’s retail tables.
What the retail figures mean
FADA’s November 6 release (archived copy) recorded October retail sales of 3,172,466 vehicles, down 23.80% year on year but up 25.05% from September. Passenger-vehicle registrations were 507,768 and two-wheelers 2,321,419. FADA attributed much of the annual decline to the festive-calendar comparison, rather than treating it as a straightforward collapse in demand.
The retail dataset was collated as of November 4 from 1,468 of 1,469 RTOs. Telangana figures were unavailable for three-wheelers, commercial vehicles and tractors. Those coverage limits matter alongside the distinction between registrations and shipments. The sensible reading is to compare like with like: domestic passenger vehicles with domestic passenger vehicles, exports separately, and retail registrations against the same retail series.
For the preceding month’s context, read our reports on September passenger-vehicle retail and September two-wheeler retail.