

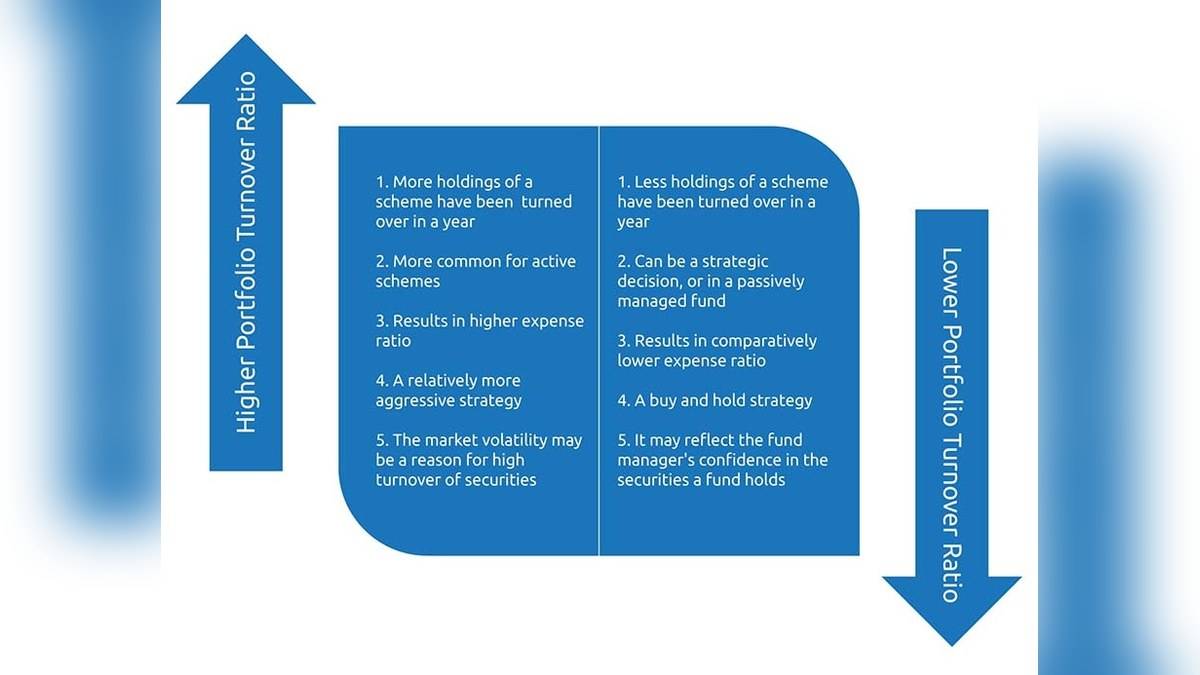
A mutual fund's portfolio turnover ratio measures trading activity inside the scheme, usually over the previous 12 months. The calculation takes the lower value of securities purchased or sold, divides it by average assets under management and expresses the result as a percentage. It does not tell you the return earned by investors.
A factsheet showing 40% turnover therefore needs a different reading from a performance table showing a 40% return. The first number describes transactions relative to the portfolio's size. The second describes a change in investment value over a stated period. Mixing them up changes the meaning entirely.
| Factsheet question | What to establish |
|---|---|
| Which period? | The period stated for the turnover calculation |
| Which numerator? | The lower of purchase value or sale value |
| Which denominator? | The average asset base specified in the methodology |
| What does it measure? | Portfolio trading activity, not investor returns |
| Is lower always better? | No, the strategy and other measures matter |
What is the portfolio turnover ratio formula?
DSP Mutual Fund's investor education guide defines the calculation using purchases and sales over 12 months and average assets under management. Written as a formula: portfolio turnover ratio = minimum of purchases and sales, divided by average AUM, multiplied by 100.
The purchase and sale inputs are rupee values for the period, not a count of transactions. Ten small trades and ten large trades cannot be treated as identical inputs. Average AUM is the portfolio's average asset base used in the calculation; it is not the market value of one investor's account.
Read the methodology alongside the number. A month printed on a factsheet identifies the report, but does not by itself establish that turnover covers only that month. DSP describes the measure as usually disclosed for the last year. The period attached to the specific figure is what determines its meaning.
How do you calculate portfolio turnover? A worked example
Take a fictional equity scheme with purchases of Rs 360 crore and sales of Rs 240 crore over a year. Assume its average AUM for the same period is Rs 600 crore. The lower transaction value is Rs 240 crore. Dividing Rs 240 crore by Rs 600 crore and multiplying by 100 gives turnover of 40%.
Adding purchases and sales would give Rs 600 crore and a result of 100%. That is not the formula described here. Using only purchases would give 60%, which is also wrong for these inputs. The lower-value rule is why the calculation starts with Rs 240 crore.
Now leave sales and average AUM unchanged, but raise purchases to Rs 480 crore. Turnover remains 40%, because sales are still the smaller input. This arithmetic shows why a low turnover number cannot establish that a manager barely bought anything. The ratio compresses two different transaction totals into one measure.
These figures are calculations for illustration, not the reported portfolio of a real fund. For another independently calculated example, Nippon India Mutual Fund's education page uses purchases of Rs 1,000 crore, sales of Rs 800 crore and average AUM of Rs 1,200 crore, giving approximately 66.667%.
Does 100% turnover mean every holding was sold?
No. Nippon India explicitly cautions that 100% turnover does not necessarily mean every security was bought or sold. The figure aggregates transaction values; it does not list which holdings changed. Different combinations of trades can generate the same total, so the ratio alone cannot identify the securities retained throughout the period.
It also cannot establish an exact holding period for each security. To understand what the scheme actually held, the portfolio disclosure is a separate document to examine. A turnover figure and a holdings list answer different questions: one summarises activity, while the other identifies investments at the reported point in time.
Is a high or low turnover ratio better?
DSP links frequent portfolio changes with transaction costs borne by the fund, which may affect returns. A lower figure can be consistent with a buy and hold approach. However, the guide expressly rejects the idea that low turnover is automatically better. Trading activity reflects both management style and market conditions.
RBL Bank's factsheet glossary also describes turnover as a measure of portfolio churn over the preceding year. Neither that definition nor the formula supplies a universal percentage that separates a good fund from a bad one. The metric cannot replace an explanation of the scheme's objective or its risks.
Comparisons also need similar strategies. DSP says a diversified equity fund and a sector fund are not a like-for-like comparison. Its guide cautions against applying this equity interpretation to debt, index and arbitrage funds, where interest rate decisions, index replication or derivative expiry can give trading activity a different purpose.
Keep the other factsheet measures separate. Our guides explain the expense ratio and its calculation, the Riskometer's risk labels and what mutual fund NAV measures. Turnover adds a view of trading activity to those measures; it does not supply a return forecast or a reason, by itself, to buy or sell a scheme.