
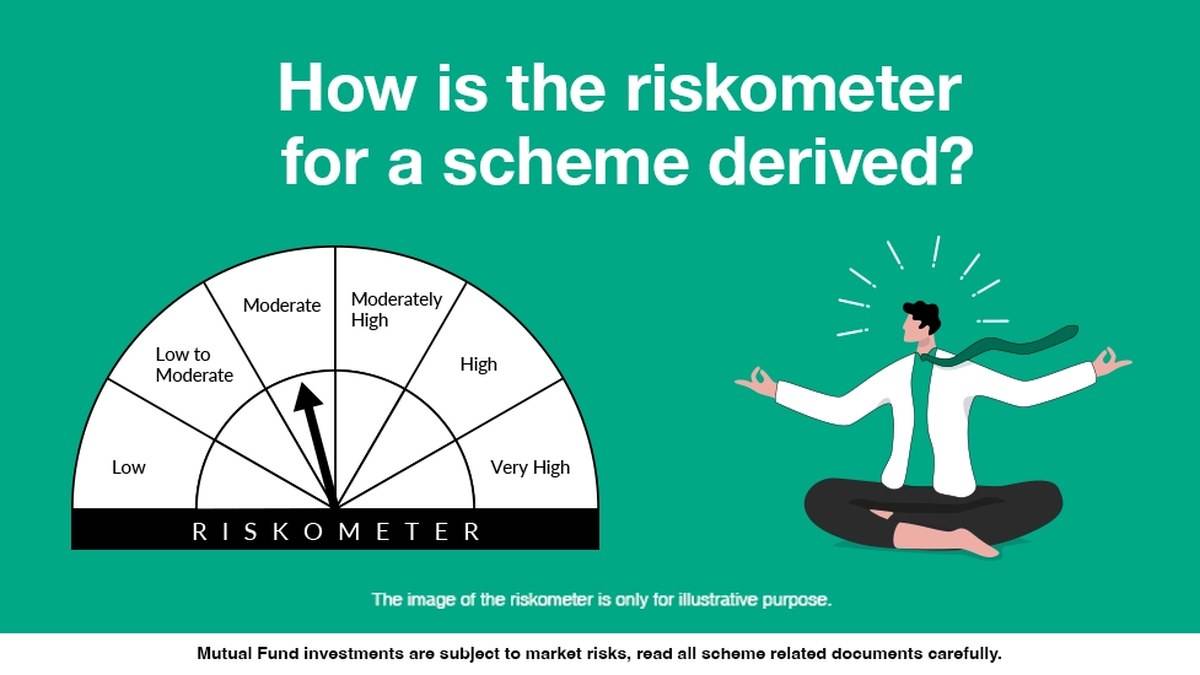
A mutual fund Riskometer shows the risk level assigned to a scheme's portfolio, using six labels from Low to Very High. It helps readers understand the nature of the risk they are taking. It does not predict next month's return, give a probability of loss or guarantee that a fund with a lower label will preserve every rupee invested.
| Question | Answer |
|---|---|
| How many levels? | Six, from Low to Very High |
| How often evaluated? | Monthly |
| Where to check? | The AMC's official disclosures and AMFI |
| What to compare? | The same scheme and the same disclosure date |
The Association of Mutual Funds in India's explanation of the Riskometer methodology describes how the assets inside a portfolio contribute to the assessment. That makes the label more useful than a conclusion drawn only from a scheme's name. Two products can sound similar while holding securities with different credit, liquidity or price risks.
What are the six mutual fund Riskometer levels?
The labels are Low, Low to Moderate, Moderate, Moderately High, High and Very High. They form an ordered scale of portfolio risk. The difference between adjacent labels should not be translated into a fixed percentage return or a fixed percentage chance of losing money. The labels describe categories, not a personal forecast for an investor.
A label also needs its date. A screenshot saved when a scheme opened may show an assessment based on its proposed characteristics. A later disclosure reflects the portfolio being evaluated at that time. Reading the latest label alongside an older one can reveal a change that the scheme name alone would never show.
For the background on product names, see our guide to mutual fund categories and factsheets. A category describes the scheme's permitted investment framework. The Riskometer describes assessed risk. Neither field makes the other unnecessary.
How is a mutual fund Riskometer calculated?
For equities, AMFI's educational explanation identifies market capitalisation, volatility and impact cost as the main inputs. Market capitalisation concerns the size of the company. Volatility concerns how sharply its price moves. Impact cost concerns the price effect of executing a trade, which becomes especially relevant where market liquidity is limited.
These factors answer different questions. A share can trade actively and still move sharply in price. Another can appear quiet until a sizeable order moves its price substantially. Looking only at recent price stability therefore leaves out part of the portfolio's risk picture. The assessment uses more than one characteristic of the holding.
For debt securities, the explanation identifies credit risk, interest rate risk and liquidity risk. Credit risk concerns the possibility that an issuer will fail to meet its obligations. Interest rate risk concerns sensitivity to changes in rates. Liquidity risk concerns the ability to sell a security when required without an unfavourable price adjustment.
A debt fund is consequently not equivalent to a bank deposit simply because both are described using interest related language. The securities in the portfolio still have market and issuer risks. AMFI also describes risk treatment for other assets, including cash, derivatives and gold. The portfolio assessment brings the applicable components together.
When is the Riskometer updated?
AMFI says each scheme's Riskometer is evaluated monthly, with the updated disclosure available on the AMC and AMFI websites within ten days of the month ending. Readers can start with AMFI's Riskometer disclosure section and then check the relevant fund house's official records.
When comparing two documents, match the full scheme name, disclosure month and the label being shown. A factsheet can contain both a scheme Riskometer and a benchmark Riskometer. The benchmark describes the reference portfolio used for comparison. Its label should not be mistaken for the scheme's own assessment.
A change deserves a closer look at the corresponding portfolio disclosure. It is a reason to understand what has changed, rather than evidence by itself that a return is about to rise or fall. Keep the previous disclosure if you want to track changes over time, and record its month rather than relying on an undated image.
How to read the label alongside a factsheet
Use the Riskometer with the investment objective, portfolio, expense ratio and withdrawal conditions. Our expense ratio explainer explains the cost field. Our NAV guide explains why a low unit value does not itself identify a cheaper or safer investment.
Finally, a portfolio's risk label and a person's capacity to bear losses are separate questions. The dial cannot know when a household needs its money or how it would handle a fall in value. Reading the official label accurately is the first task. Treating it as a complete assessment of personal suitability would ask it to do a job it was not designed to perform.