
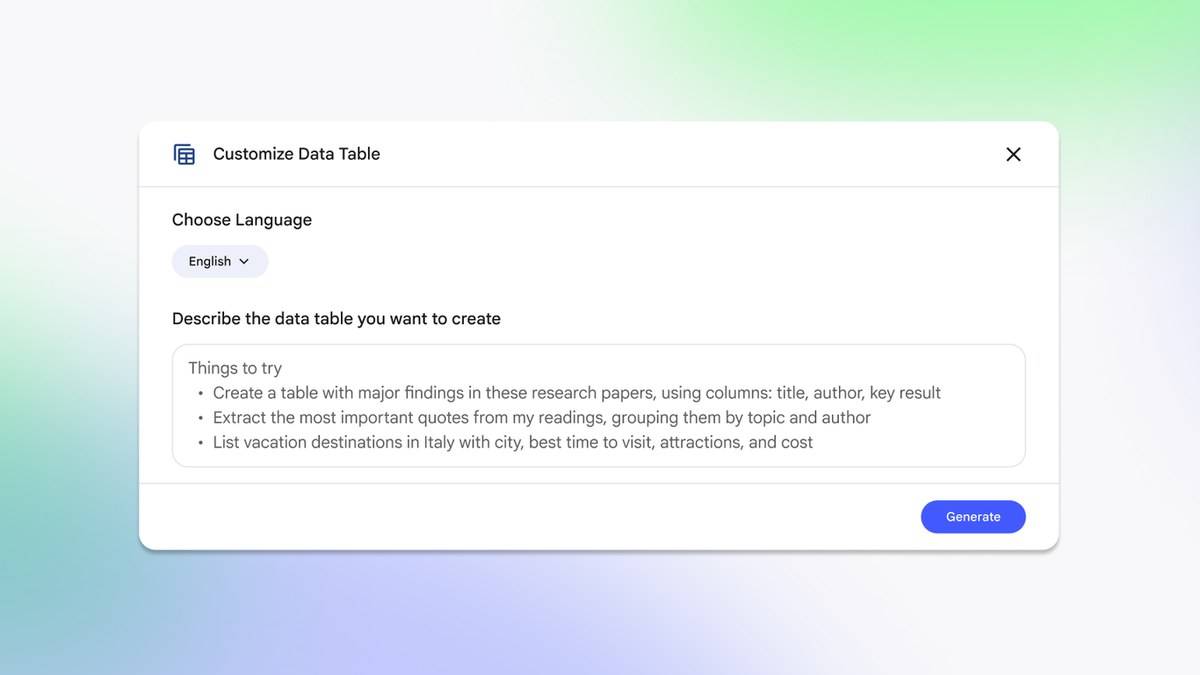
To create a data table in NotebookLM, open a notebook in the web version, go to Studio and select Data Tables. Use the pencil icon to specify a language and describe the rows and columns you want. Google's current help pages call the product Gemini Notebook, so searchers using the NotebookLM name may encounter that newer wording in the instructions.
| Task | Where to look |
|---|---|
| Create a table | Studio, then Data Tables |
| Define the structure | Pencil icon and custom prompt |
| Export the result | Table's three-dot menu, then Export to Sheets |
| Check the evidence | Original sources and exported citations |
The steps below were checked against Google's public help on 6 November 2026. They were not tested inside a signed-in account, and the examples are original prompts rather than recorded model outputs. The aim is a source-based comparison or extraction task where you can inspect the evidence behind each row.
How do you create and export NotebookLM data tables?
Google's create-a-notebook help page describes adding sources and generating outputs in Studio. For Data Tables, it specifically allows a language choice and a prompt describing rows and columns. Start with one clearly defined question, such as extracting deadlines from a small set of notices, rather than asking the app to organise everything you have collected.
After generation, use the table's three-dot menu and choose Export to Sheets. Google says the table content goes into the first tab of a new spreadsheet and citations into the second. Keep both tabs. A table of claims separated from its evidence is harder to check, especially when several documents contain similar names or dates.
Google also says changes made in an exported document or spreadsheet do not synchronise back into the notebook, and notebook sharing permissions do not carry over to exports. Treat the spreadsheet as a separate file whose edits and access need their own review. This matters when a group moves from private research to a shared final document.
Five data table prompts you can adapt
For revision: “Using only the selected history chapter, create one row per event. Use columns for event name, date stated in the chapter, people involved, cause, consequence and source reference. Write ‘not stated’ where the chapter does not provide a detail. Do not add dates from general knowledge.” This makes gaps visible instead of encouraging a polished but unsupported study sheet.
For meeting follow-up: “Extract action items from these meeting notes. Use columns for task, named owner, deadline exactly as written, dependency and supporting passage. If an owner or deadline is missing, write ‘not assigned’. Keep suggestions separate from decisions.” This is useful when a discussion contains possible actions that nobody actually accepted.
For comparing courses: “Compare only the supplied official course descriptions. Use one row per course, with provider, eligibility, duration, assessment, certificate conditions and source reference. Preserve the wording of conditional requirements. Mark missing information ‘not stated’; do not rank the courses.” The purpose is to expose differences that a short summary might overlook.
For a literature review: “Build a table of these research papers with title, publication year, research question, method, sample described, principal finding and author-stated limitation. Put each finding beside its own source reference. Distinguish the authors' conclusions from my notes.” This prompt asks for evidence organisation, not an automated verdict on which paper is correct.
For a community event plan: “From the selected event documents, create a table with activity, date and time as written, location, responsible team, prerequisite and source reference. Flag contradictory entries rather than choosing one silently. Do not infer a year or time zone that is absent.” Use this to identify what needs checking before circulating a schedule.
Why is a source missing or a table incomplete?
Check what the notebook actually imported. Google's source help page says a normal webpage import brings in its text, not embedded images, videos or nested pages. If a figure exists only in a picture or on a linked page, importing the parent webpage may not supply that evidence. Inspect the source before asking for another extraction.
The same help page says generated Studio outputs do not change when a source is updated or deleted. If a notice has changed since the table was made, compare the output with the current source and generate a fresh table as needed. Do not assume an existing artifact has refreshed merely because the underlying document is newer.
If Data Tables is missing from an app interface, check Google's app feature limitations before looking for a workaround. At the time checked, that page says generating data tables is not yet available in the mobile app. The documented web workflow is the appropriate reference; this guide does not claim that every interface has identical controls.
Google's original Data Tables announcement describes organising scattered source material for study, meetings and research. For other output formats, see our Devialet brings Phantom Ultimate Pulse Blue to India at Rs 2.4 lakh, Pixel 10 India price: Rs 79,999 on Google Store, Rs 74,999 with offer and Pixel 10a now Rs 55,999 on Google Store India, Rs 6,000 above launch price. With any format, check names, numbers and qualifiers against the source before reusing the result.