Gurugram's Built-Up Footprint Expands 64% in a Decade
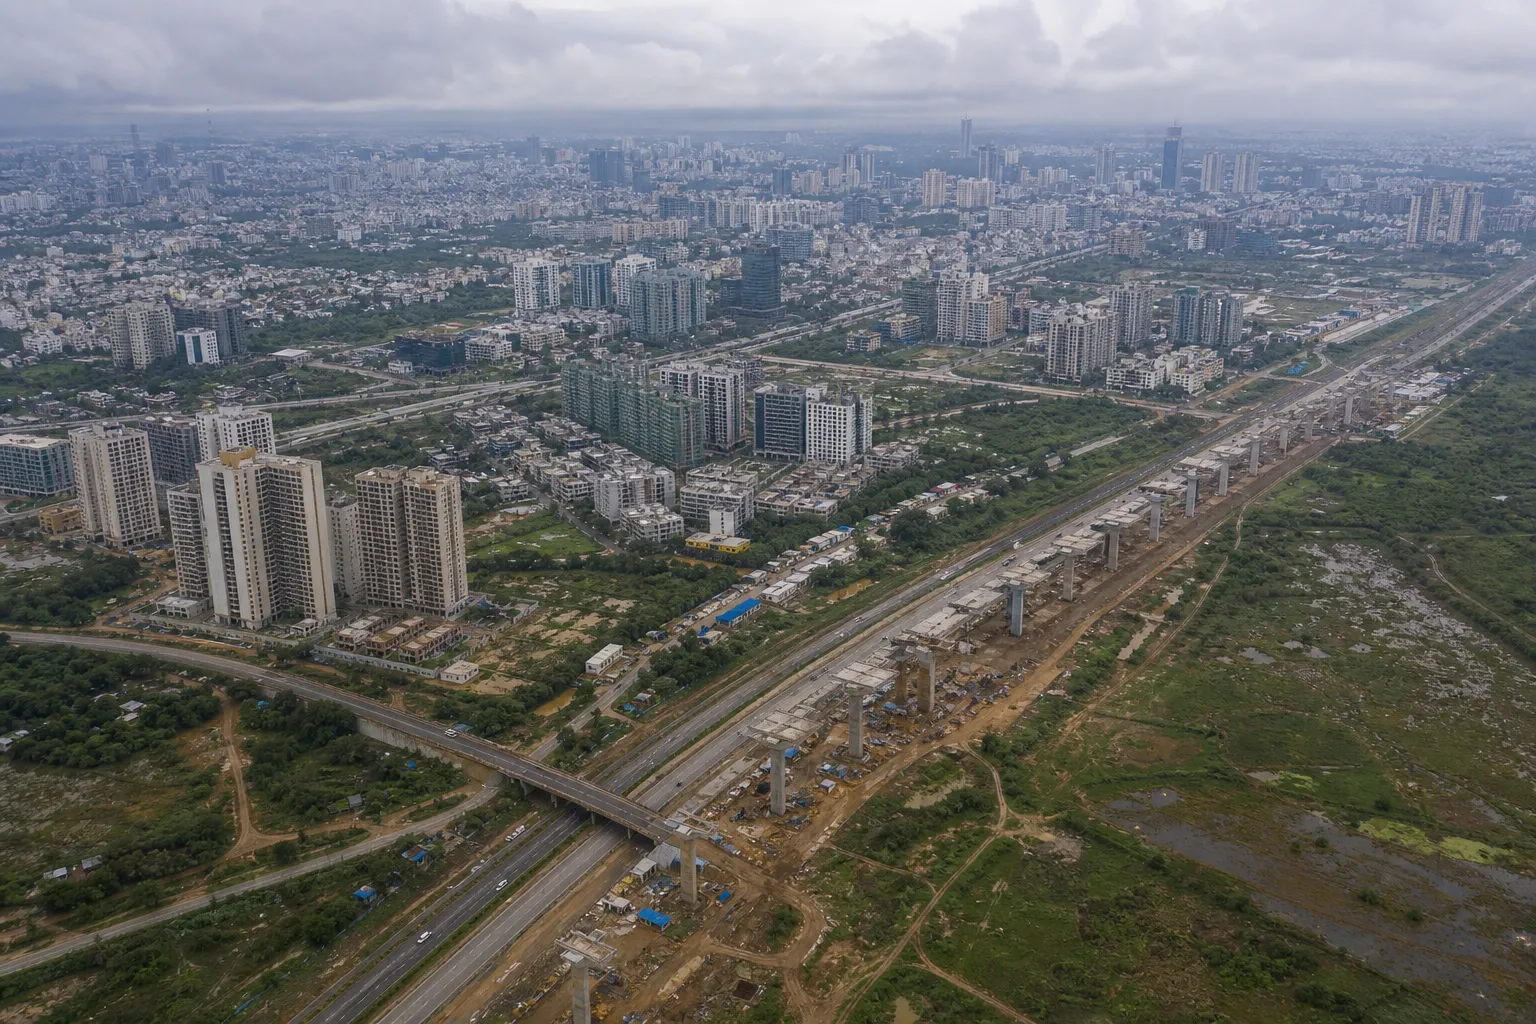
Gurugram added almost 66 square kilometres of built-up land in ten years, a pace of physical expansion that helps explain why roads, drains and water networks so often feel one step behind the skyline. A new satellite-based assessment by the Gurugram Metropolitan Development Authority places the built-up footprint at 168.2 sq km in 2025, up from 102.5 sq km in 2015.
The increase works out to about 64 per cent. GMDA's GIS division used high-resolution satellite imagery, spatial mapping, statistical methods and machine-learning tools to compare the two years. The authority says the mapping accuracy exceeded 92 per cent. Built-up land in such studies typically includes buildings and associated developed surfaces; it should not be confused with the city's population or total administrative area.
The strongest growth was recorded along corridors that residents already recognise as the new map of Gurugram: Dwarka Expressway, Southern Peripheral Road, Golf Course Extension Road, Sohna Road, NH-8 and New Gurugram. Expansion around Cyber City, Udyog Vihar and IMT Manesar also reflects the way employment districts pull housing, shops, schools and daily traffic into their orbit.
A 64 per cent rise is not automatically evidence of bad planning. Cities grow because people need homes and businesses need space. The warning lies in the sequence. If permissions and construction arrive before trunk drainage, drinking-water capacity, sewage treatment, public transport and street connections, residents inherit expensive buildings connected by temporary solutions.
The GIS study can help agencies move beyond complaint-based planning. Overlaying new construction with waterlogging points, sewer capacity, road widths, bus routes and emergency response times can reveal which corridors are absorbing growth without matching services. It can also identify remaining open land that performs a flood-storage or ecological role even if it looks vacant on a revenue map.
Transport planning is an obvious use. A tower cluster may generate thousands of trips before a junction redesign or transit route is ready. Satellite evidence can show where density is rising, but planners should pair it with travel surveys and pedestrian counts. More road space alone cannot solve every trip created by a spread-out city.
The same applies to water. New sectors need a credible source of supply, distribution pressure, sewer links and treatment capacity. Borewells and tankers can disguise a network gap for several years, while untreated discharge appears later in drains or low-lying land. A decade map should therefore be used to forecast demand, not merely to celebrate investment.
GMDA says the findings will inform decisions on roads, drainage, water, sewerage, transit and traffic management. The public value will depend on whether the map and methodology are released in a usable form and updated regularly. Gurugram's next decade will add more built space. The test is whether its infrastructure map can finally grow before, rather than after, the construction cranes.
Sources and reporting
Based on GMDA's GIS assessment of high-resolution satellite imagery from 2015 and 2025 and the planning uses described for the study.
Related Stories
Four Held for Stone Attack on Manesar Drive
GMDA Plans Rs 20 Cr Dwarka Sector Road Works
Metro Phase-2 Tender Delay Puts 2029 at Risk
SC Flags IAF Depot Buffer Encroachments
DTCP Seals 17 Sites in Sushant Lok Drive