
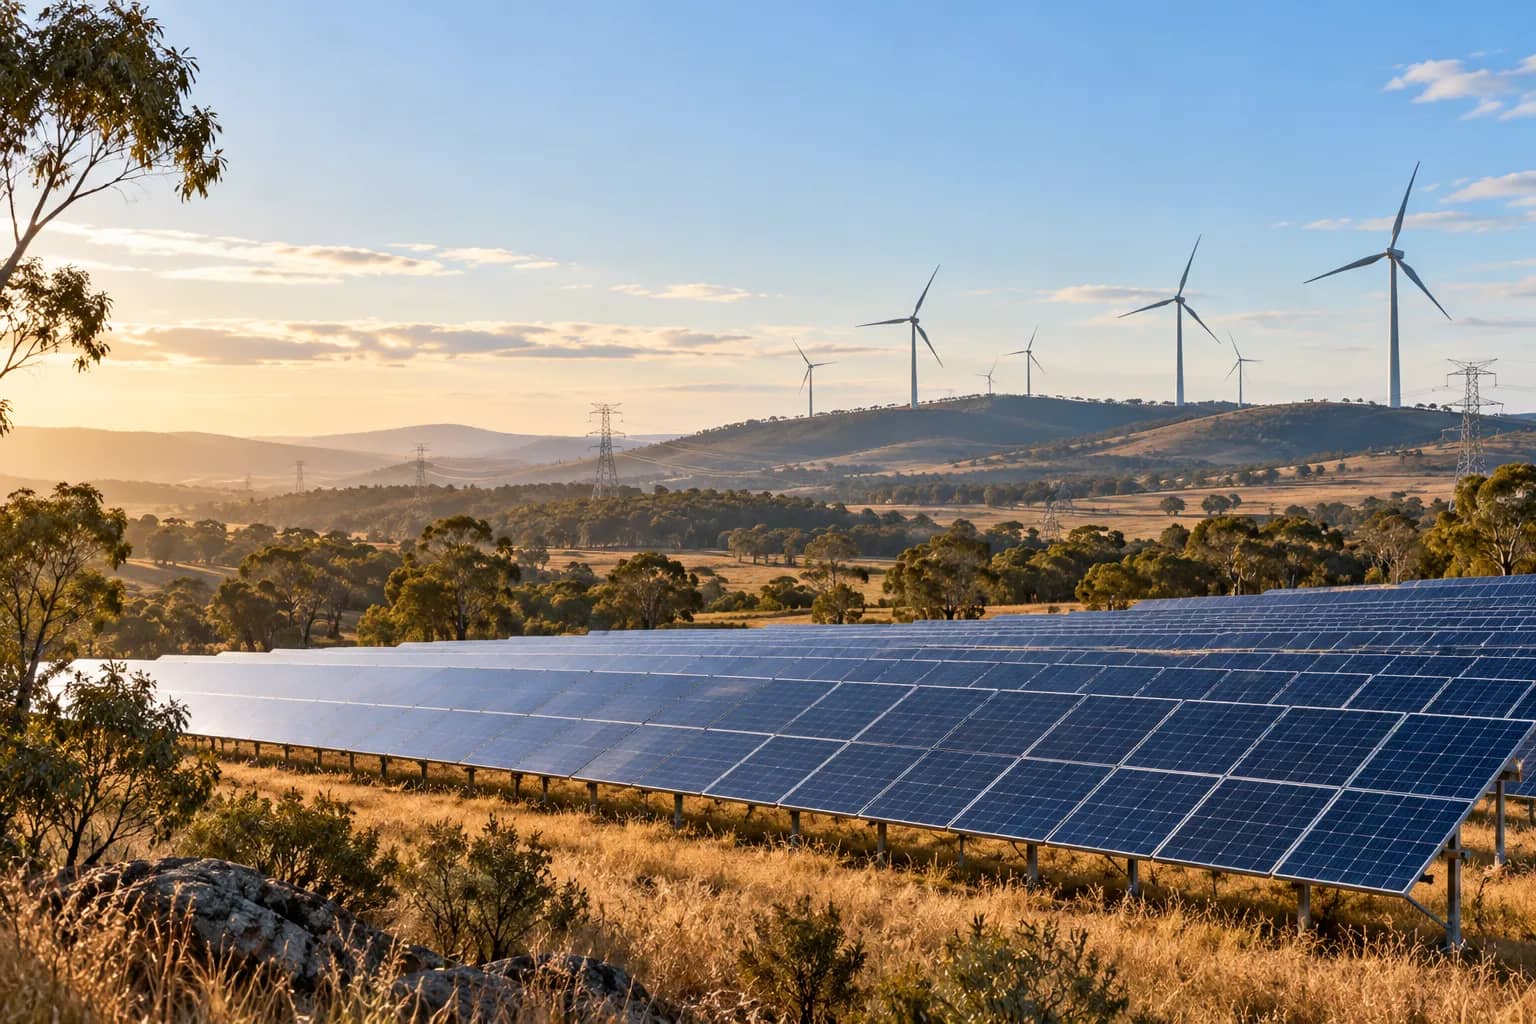
Australia's physical energy exports fell to their lowest level in a decade in the 2024-25 financial year, while renewable sources supplied a larger share of the electricity used at home, according to new Australian Bureau of Statistics figures released on October 29.
The Energy Account, Australia puts exports at 17,363 petajoules, down 3.1% from the previous year. This is a measure of the energy contained in exported products, rather than the money earned from selling them. The newly published account describes 2024-25, not Australia's current export volumes or electricity mix in October 2026.
Black coal remained the largest energy export, although its exported energy content fell 1.1%. Liquefied natural gas exports fell 2.2%, the ABS said in its accompanying release. Across exports, industry and households, the account's total net energy use declined 2.8% to 23,037 petajoules.
Renewables grow, but exports remain fossil-fuel heavy
Renewable electricity production rose 9.7% to 372 petajoules. Those sources supplied 37% of domestic electricity use, compared with 34% a year earlier. The percentage relates to electricity, not all energy consumed in transport, factories or homes. Treating it as a share of Australia's entire energy system would overstate what the figures show.
Solar was the largest renewable source, rising 11% to 191 petajoules, while wind output increased 15% to 130 petajoules. Wind returned to growth after falling in the previous year. Hydropower moved in the opposite direction, dropping 5.6% to 51 petajoules in its third consecutive annual decline.
The production figures also show how much Australian energy is destined for overseas users. Black coal production totalled 10,607 petajoules, with 92% exported. Natural gas production was 5,669 petajoules, of which 77% was exported as LNG. All of the brown coal recorded in domestic production was used to generate electricity within Australia.
Domestic industrial demand was uneven. Manufacturing energy use fell 5.6% to 992 petajoules, while the electricity, gas, water and waste services group used 3% less energy. Construction use rose 13.9% and transport, postal and warehousing use increased 4.1%. Taken together, industry net use fell 1.2% to 4,642 petajoules.
Industry also used less energy for each unit of economic output on average. The ABS energy-intensity measure fell from 1,835 to 1,779 gigajoules per million dollars of gross value added. Electricity, gas, water and waste services and manufacturing both recorded lower intensity, but mining and transport recorded small increases. This output-based measure is different from the absolute quantity of energy consumed.
Household energy use and its monetary value diverge
Households used 998 petajoules of energy, an increase of just 0.3%. Petrol, electricity and natural gas remained their main energy products. The ABS said energy use per person had fallen 16% over ten years because population had grown faster than total energy use. That comparison does not mean every household reduced its consumption.
This release brings back household monetary estimates for the first time since the 2021-22 accounts. The value of the main energy products used by households fell 7.4% to A$56.2 billion in 2024-25. Petrol accounted for A$23.3 billion, down 8.6%, while electricity was valued at A$18.9 billion, down 10.4%. Natural gas moved against that trend, increasing 3.5% to A$8.9 billion.
The electricity figure is net of government rebates. The account also values energy produced for households' own use, including electricity, rather than simply adding up their bills. Its monetary estimates are in nominal terms and the valuation excludes GST. They should therefore not be read as a direct measure of the cash saving on an individual electricity account.
The ABS cautions that dividing monetary values by physical quantities does not necessarily produce a reliable measure of price changes. The result can shift because the mix of products changes as well as their prices. Its price indexes are designed for that comparison. Dalimss News separately covered Australia's September 2026 inflation release, which concerns a different period and statistical measure.
These historical energy findings sit alongside other economic releases, including the ABS report on job-search competition and childcare barriers. The energy account contains revisions to earlier estimates as new source data became available. Readers comparing years should use the updated series rather than mix the latest figures with superseded tables.
Source data: Australian Bureau of Statistics, Energy Account, Australia, 2024-25, accessed October 29, 2026. Adapted under CC BY 4.0.